Analytics
Read the Analytics page — the template picker, the date range and every chart — and see what the mobile app's Analytics tab adds.
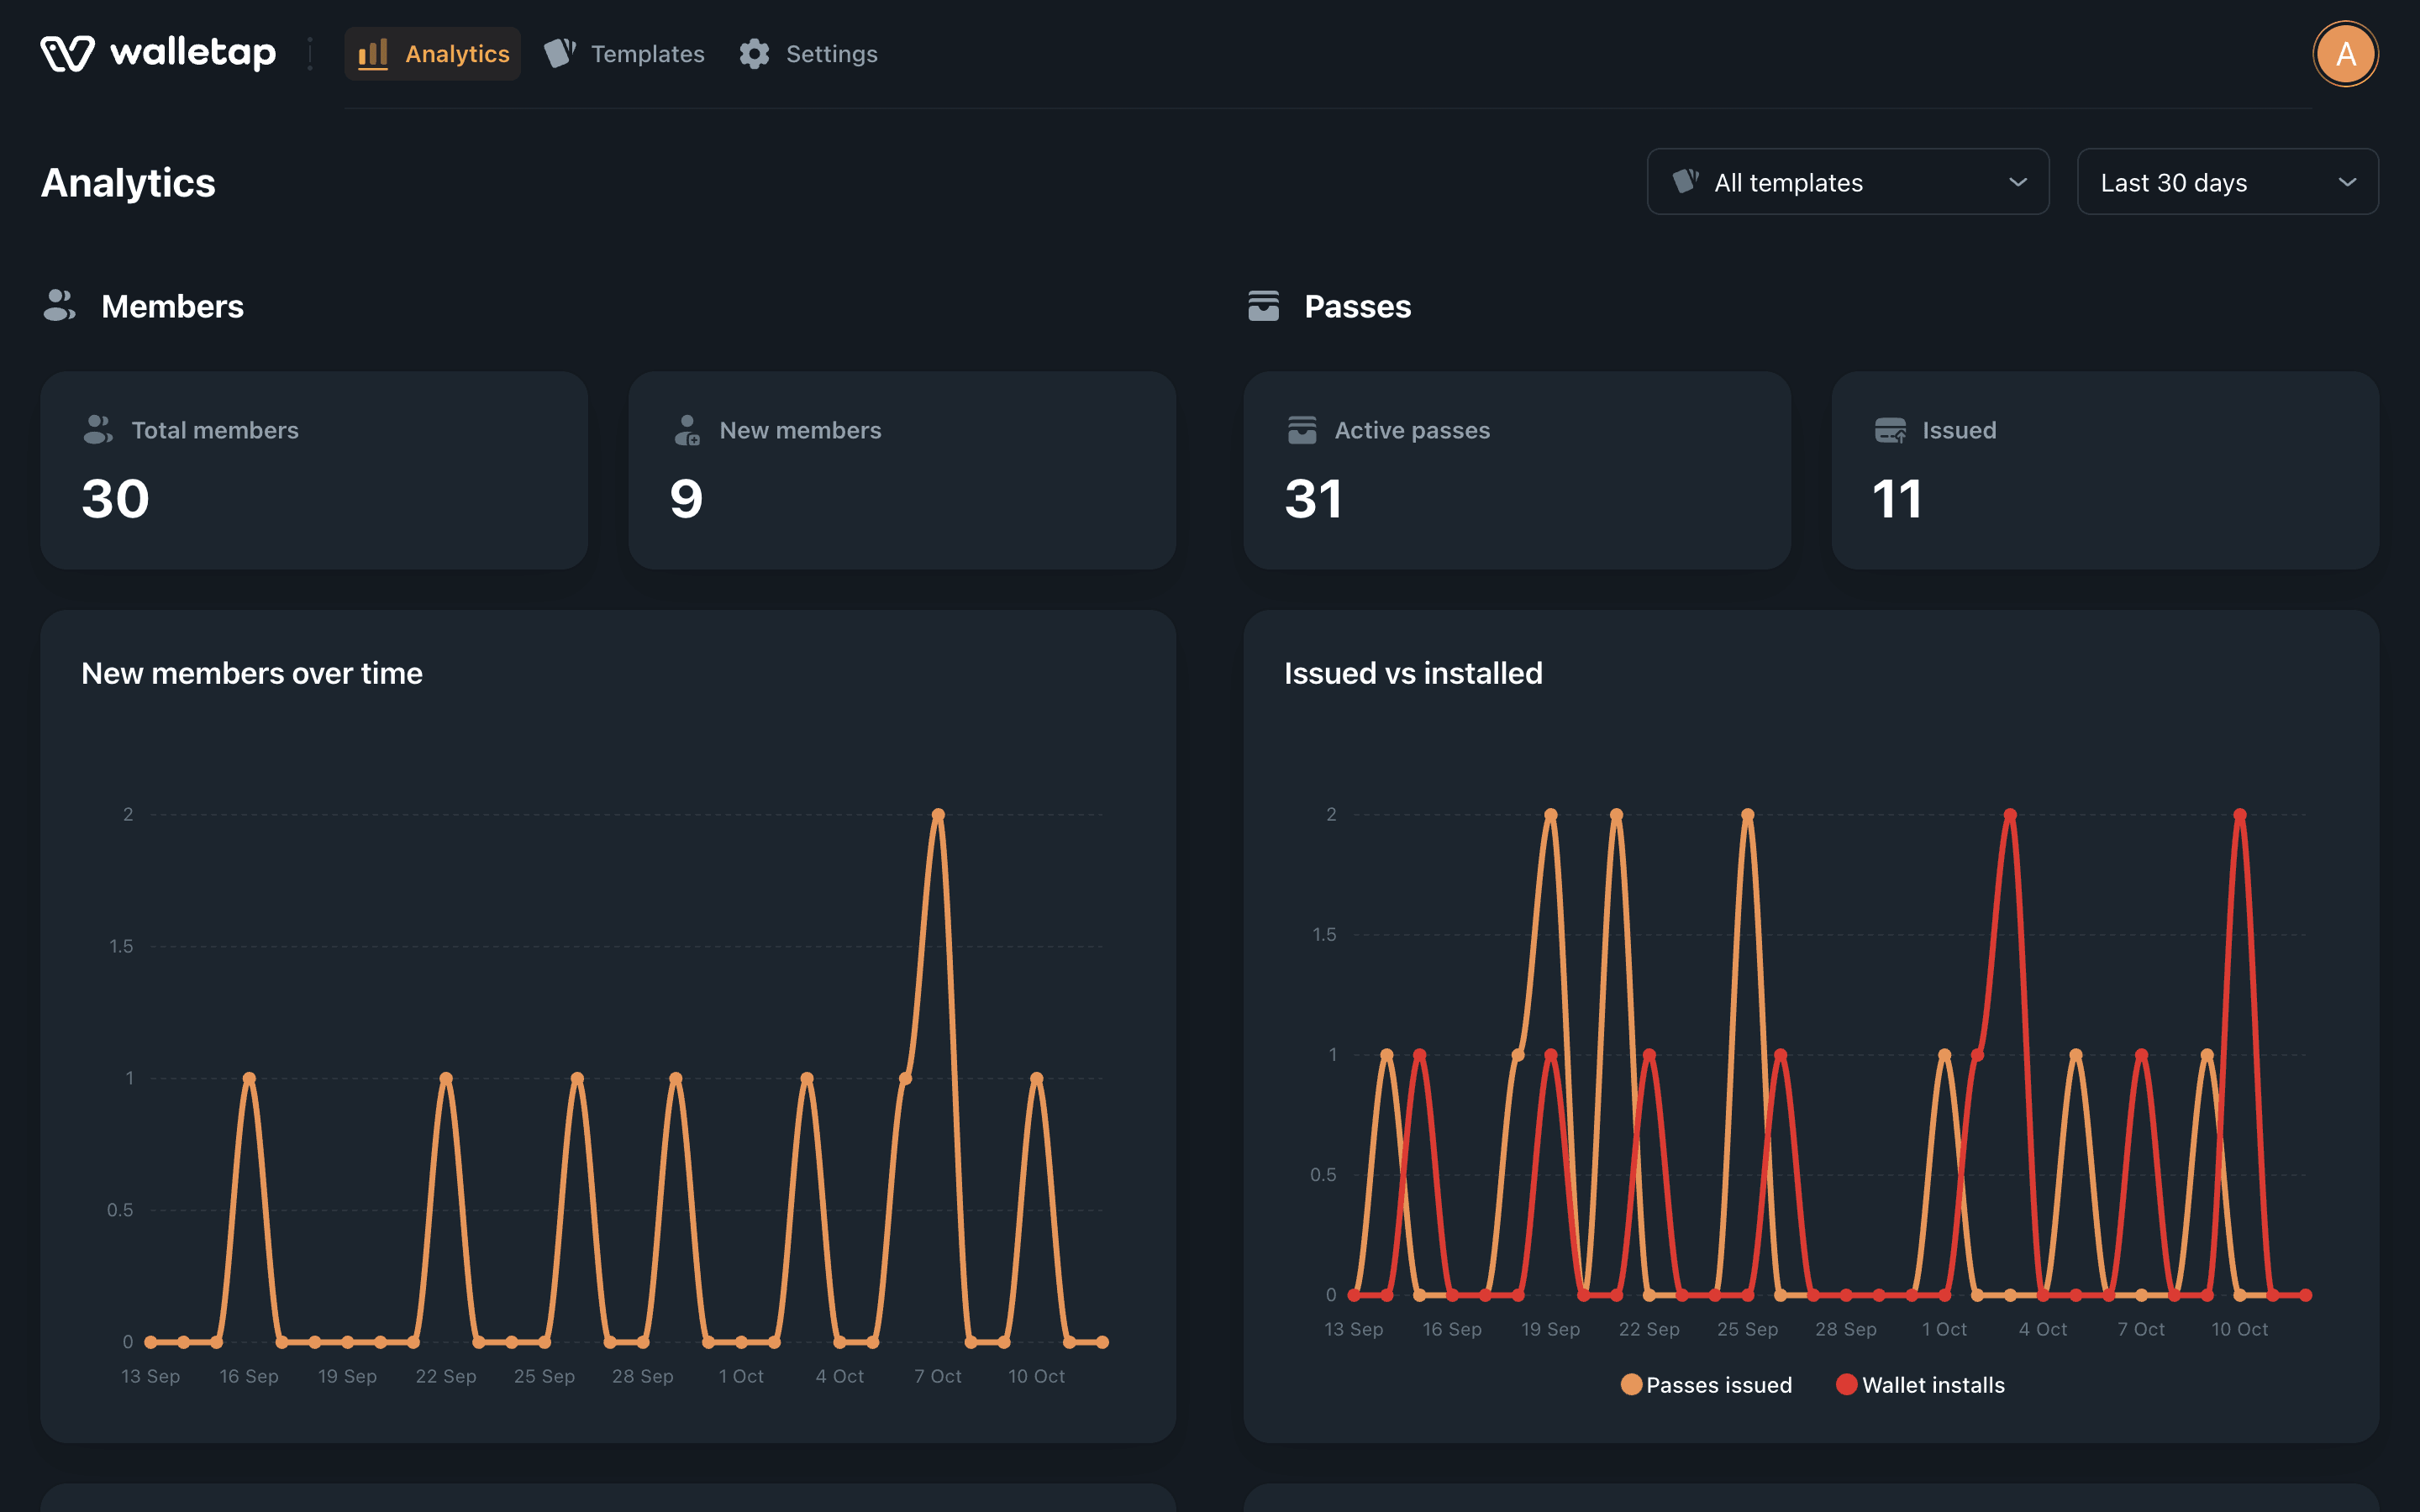
The Analytics page is the first item in the dashboard's navigation. It shows how many members and passes you have, how fast they grow, which wallets they use and where passes are scanned — for the whole account or for one template.
Every planBefore you start#
- Your role includes analytics. Owner, Admin, Marketing and Accountant see the whole account. Manager and Front-desk see scans at their own locations only. See team members.
Open the page and set the scope#
- Open Analytics
Click Analytics in the main navigation.
- Pick a range
Choose a range in the picker beside the title: Yesterday, This week, Last 7 days, Last 30 days, Last 90 days, Last 12 months or All time. Last 30 days is the default.
- Pick a template
To see one template, choose it in the template picker, which starts on All templates. The picker appears once the account has more than one template.
The Members and Passes sections follow the template picker. Locations always covers the whole account, because a counter or a door accepts every template's passes.
What each section shows#
Exact definitions of every figure are in metrics.
Members#
- Total members and New members — the tiles.
- New members over time — members who joined, per day, week or month.
- Passes by membership plan — active passes split by membership plan. Passes without a plan are grouped under No plan; an account without plans sees "No membership plans".
Passes#
- Active passes and Issued — the tiles. Active passes are counted the way your invoice counts them; see active passes.
- Issued vs installed — passes issued against passes added to a wallet.
- Active passes by wallet — Apple Wallet against Google Wallet. A pass that nobody has added to a wallet is left out of this chart.
Locations#
- Scans over time — every scan at your counters and doors.
- Scans by location — the same scans, split by the location they happened at.
Headline and full analytics#
The tiles are on every plan. The charts behind them depend on the plan.
| Part of the page | Needs |
|---|---|
| Tiles: Total members, New members, Active passes, Issued | Every plan |
| Charts over time and the plan and wallet splits | Paid plans |
| Scans by location | Paid plans |
A chart the plan does not include is drawn locked, with nothing underneath it — its figures are never downloaded. Clicking it opens the plans.
Reading the numbers#
- Today is live. Every range except Yesterday ends today. Today's figures are counted as they happen, marked today on the charts, and settle overnight.
- Levels are as of the last full day. Total members, Active passes and the plan and wallet splits are a level, not a sum. The chart says which day, for example "As of 2026-10-10", so the figure does not change with every range.
- A dash is not a zero.
—means the figure could not be worked out. Hover over it to see why. - Gaps are named. A caption such as "No data recorded for 2026-10-04" marks a day with nothing recorded, rather than drawing it as zero.
Analytics in the mobile app#
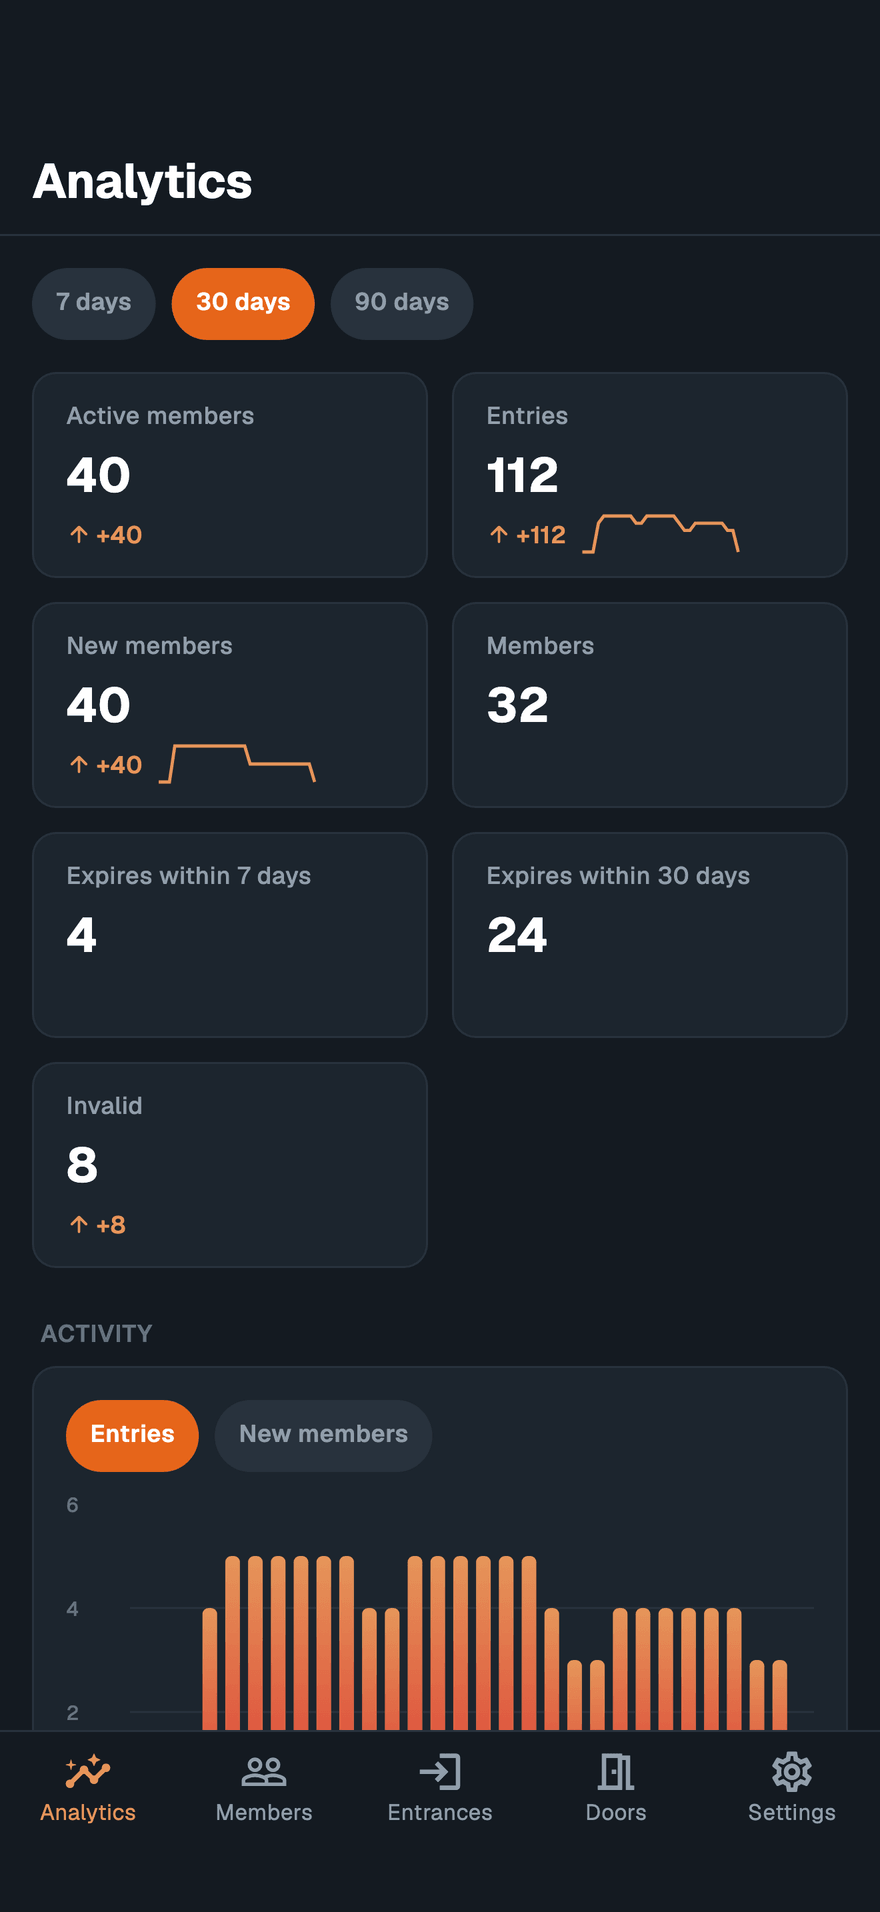
In the mobile app, Analytics is the first tab for every template and shows the template you are working in. It offers 7 days, 30 days and 90 days, and compares each figure with the period just before.
- For a loyalty template it shows visits, rewards, retention and the customers to act on — see loyalty analytics.
- For every other template it shows Active members, Entries, New members, Members, Expires within 7 days, Expires within 30 days and, when there were any, Invalid scans — followed by Activity, Peak times, Membership Plans, Wallet and Locations.
Who sees what#
| Role | Sees |
|---|---|
| Owner, Admin, Marketing, Accountant | The whole account |
| Manager, Front-desk | Scans at their own locations. Member and pass figures are recorded for the whole account, so their tiles read "Recorded account-wide only — not available for your locations." |
In the mobile app the same roles see visits and entries at their own locations, without the member totals. Member names in the app's lists need permission to view members.
If something goes wrong#
"Analytics could not be loaded." or "This section could not be loaded." Reload the page. A section that fails does not affect the others.
A figure stays the same whatever range you pick. It is a level — the number at the end of the last full day, shown by the "As of" date — not a total for the range. Total members, Active passes and the plan and wallet splits work this way.
The template picker is missing. It appears once the account has a second template.
The dashboard and the app show different numbers. They answer slightly different questions: the dashboard counts member profiles and cuts days in one time zone, the app counts valid passes in your phone's time zone. See metrics.